




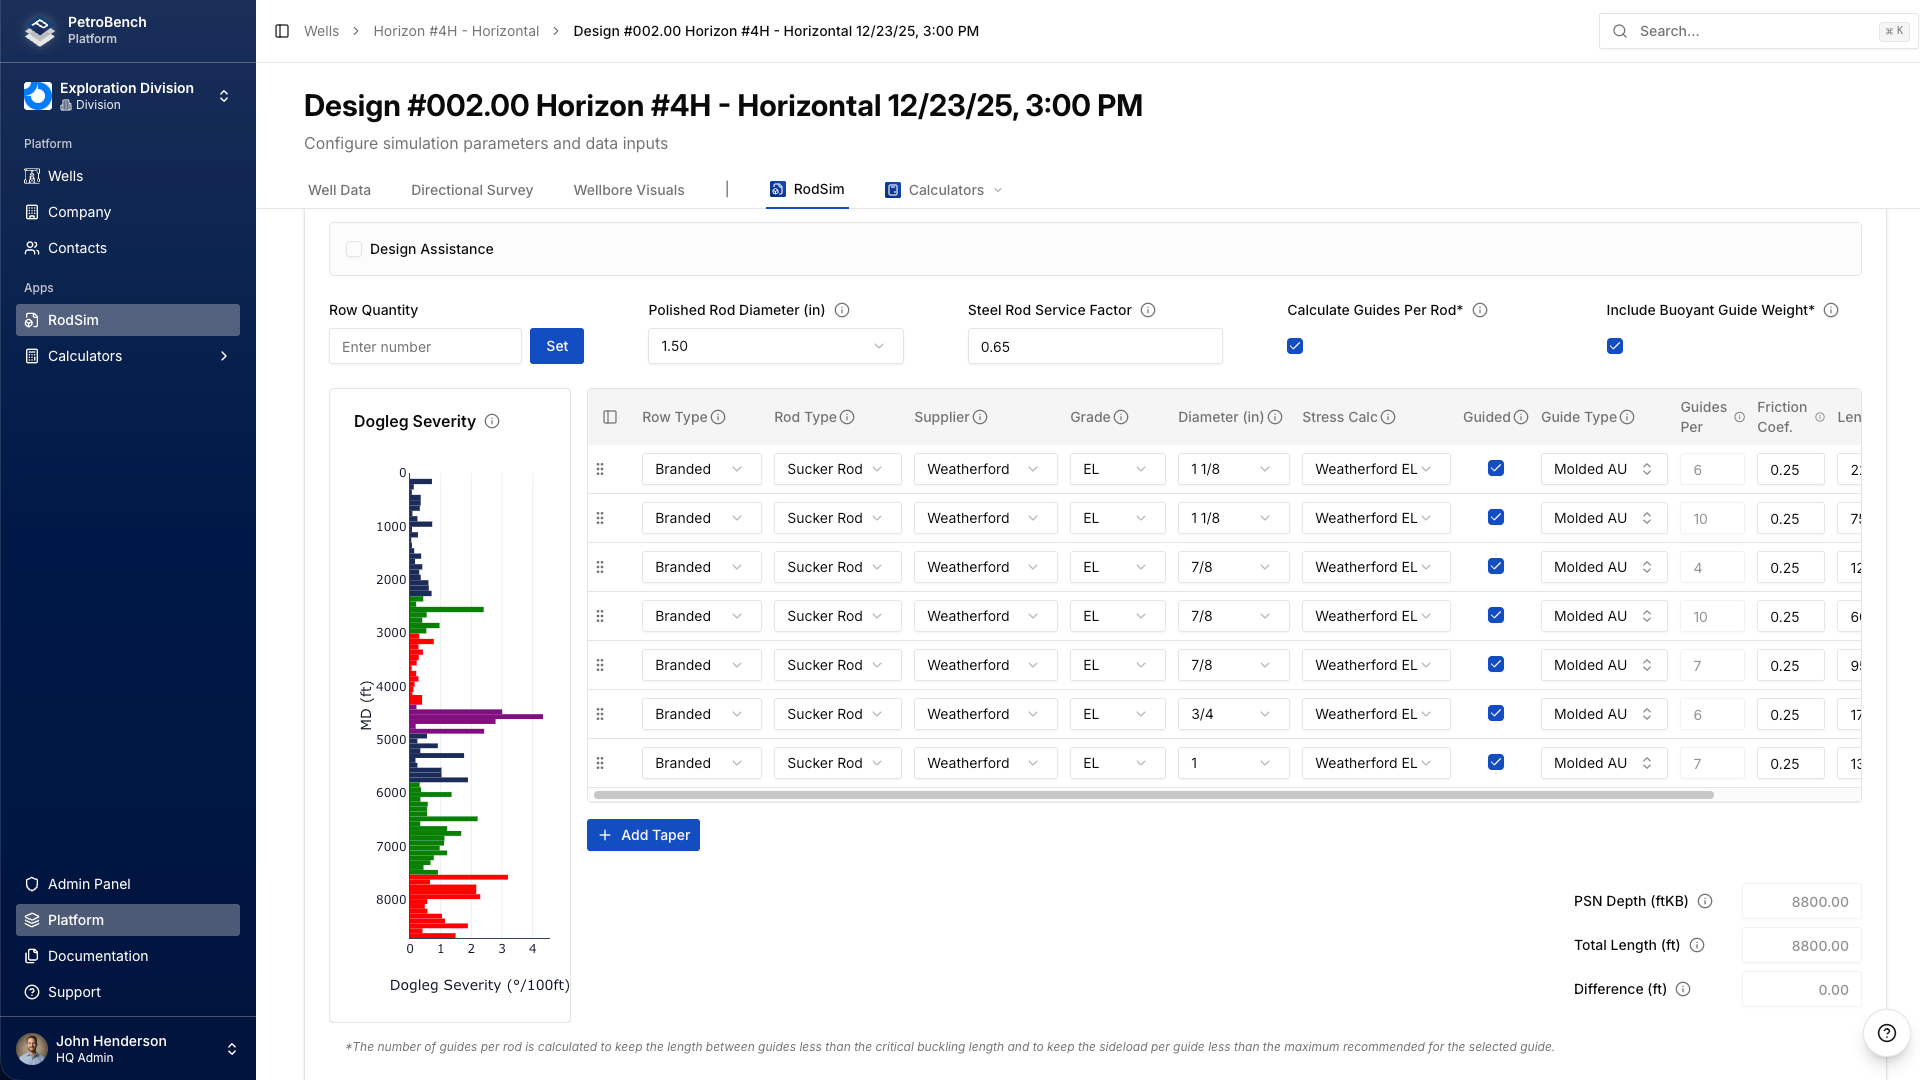
By the end of this page you will have a tapered rod string configured in RodSim, validated against pump depth, and compared against at least one alternative taper. Everything happens on one screen: the Rod Data tab of a simulation.
Open the Rod Data tab
Open the well, open the simulation, and select the RodSim tab. The input tabs run across the top: Simulation Preferences, Tubing Data, Well Data, Rod Data, IPR Data. Each shows a green check when its inputs are complete. Select Rod Data.
The taper is a table of rows, top of the string first. One row is one taper section.
Set the string basics
Three fields sit above the table.
Row Quantity sets how many taper sections the string has. Enter the count and select Set; the table adds or removes rows to match. A three taper string is three rows.
Polished Rod Diameter and Steel Rod Service Factor apply to the whole string. The service factor derates allowable stress for the operating environment; drop it below 1.0 for corrosive service.
Configure each taper row
Each row carries the fields that define that section: Row Type, Rod Type, Supplier, Grade, Diameter, and Stress Calc.
With Row Type set to Branded, the Supplier and Grade selections resolve the rod from the catalog, and the physical properties, linear weight, elastic modulus, tensile strength, come from the catalog entry. You pick what the rod is; the numbers follow.
Order the rows largest diameter at the top. The top of the string carries the string below it plus the fluid load, so a typical three taper runs 1 inch over 7/8 over 3/4.
Stress Calc sets the fatigue method per row: T over 4, T over 2, Modified Goodman, or a supplier specific method. The catalog suggests a default for the selected grade; override it per row when you want a sensitivity case.
Set lengths against pump depth
The panel below the table shows PSN Depth, Total Length, and Difference. Total Length is the sum of your row lengths; Difference is what remains against the pump seating nipple depth. Adjust row lengths until Difference reads 0.00. The string cannot be shorter or longer than the well it hangs in.
Guides, friction, and the dogleg chart
Each row has Guided, Guide Type, Guides Per, and Friction Coef. Two checkboxes above the table do the heavy lifting: Calculate Guides Per Rod spaces guides from the wellbore geometry, and Include Buoyant Guide Weight folds guide weight into the load calculation.
The Dogleg Severity chart beside the table shows where the wellbore bends hardest, in degrees per 100 ft by measured depth. Guide placement matters exactly where those bars are long; in a deviated well, check that your guided rows cover the high dogleg intervals.
Let Design Assistance propose a starting point
The Design Assistance toggle at the top of the tab proposes a taper for the well from pump depth and load. Turn it on for a defensible starting configuration, then edit the rows it produces. It is a starting point, not an answer.
Run and read the stresses
Select Static Run for a quick pass or Dynamic Run for the full wave equation solution. In the results, look at the loading for each section against its Stress Calc method. The top rod of each taper section carries the highest load in that section, so the transitions are where an under designed string shows first.
Compare taper designs
Select Compare to put configurations side by side. The fastest loop: duplicate the simulation, change one thing in the variant, run both, compare. The comparison view shows up to five designs with loads, stresses, and production estimates in columns, so a 7/8 top section versus a 1 inch top section becomes one screen instead of two browser tabs.
What to check
Difference reads 0.00 against PSN Depth. The Rod Data tab shows its green check. Every row resolves a catalog grade rather than a custom placeholder. No section's loading exceeds its method's allowable range in the results, and the guided rows cover the intervals where the dogleg chart is loudest.
Related: How to Use the Comparison View. How to Interpret Side Load Results in Deviated Wells.